Machine Learning Prediction of Age and Alzheimer's Disease from DNA Methylation Profiles

/

DATA SCIENCE / MACHINE LEARNING

Developed an end‑to‑end machine learning pipeline to predict biological age and Alzheimer’s disease risk from large‑scale DNA methylation profiles, transforming raw high‑dimensional genomic data into actionable clinical insights through rigorous data preprocessing, feature engineering, and model optimization. Applied statistical analysis and dimensionality reduction techniques to identify predictive epigenetic markers, then trained and evaluated supervised learning models (including regularized algorithms and tree‑based methods) using cross‑validation, performance benchmarking, and error analysis to ensure robustness and generalizability. Focused on model interpretability and reproducibility by documenting the full data workflow, validating results against published findings, and highlighting implications for early detection, chronic disease management, and personalized medicine

JAN 2025 - JULY 2025

Technical Skills and Methods

Machine Learning & Model Development

  • Gradient Boosting Frameworks: Implemented LightGBM (LGBMRegressor, LGBMClassifier) for regression and classification tasks on high-dimensional datasets with 450K-850K features

  • Hyperparameter Optimization: Utilized Optuna for automated hyperparameter tuning to maximize model performance

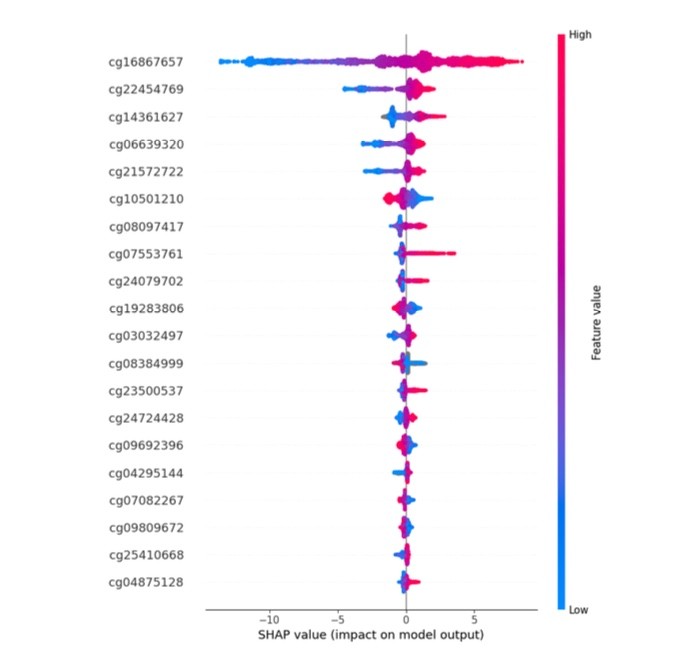
  • Model Interpretability: Applied SHAP (SHapley Additive exPlanations) values for feature importance analysis and model explanation

  • Cross-Validation: Performed k-fold cross-validation to ensure robust model generalization and prevent overfitting

Data Processing & Feature Engineering

  • High-Dimensional Data Management: Engineered efficient chunking strategies to handle datasets with 485K-893K features while managing computational constraints

  • Missing Data Handling: Developed preprocessing pipelines to address datasets with 368K-510K missing values across multiple features

  • Feature Selection: Extracted top contributing features (500 CpG sites) from large feature spaces using SHAP-based importance ranking

  • Data Integration: Merged multi-platform datasets (Illumina 450K and 850K arrays) while managing platform-specific missing data

Statistical Analysis

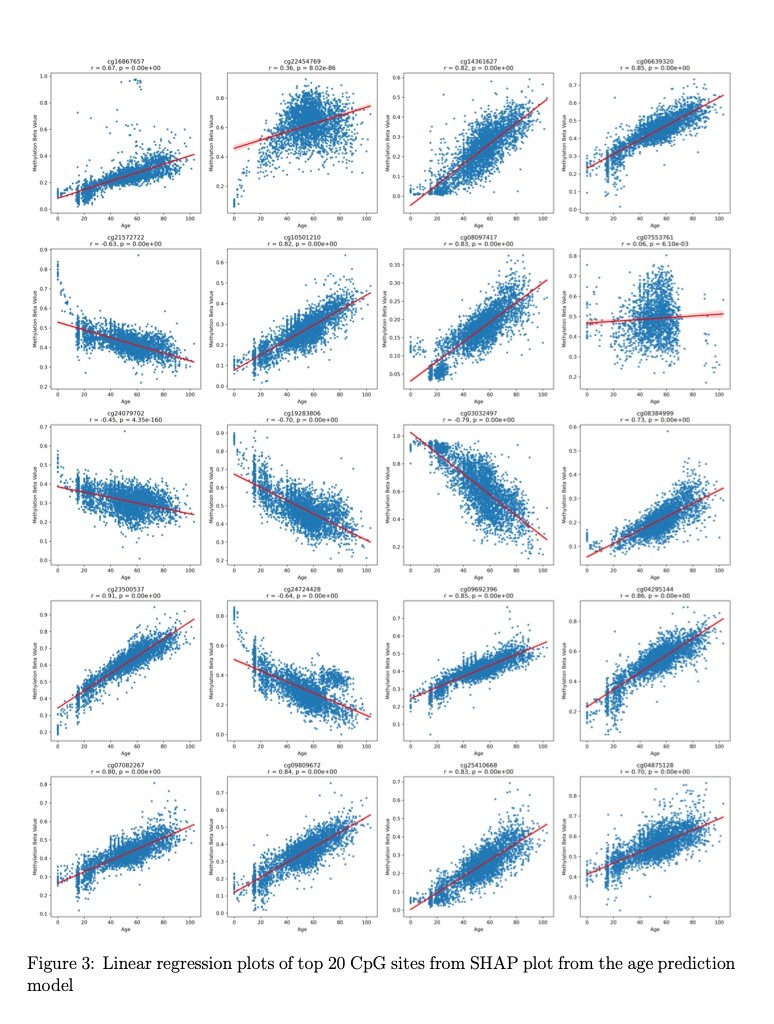
  • Correlation Analysis: Conducted Pearson correlation coefficient analysis to assess relationships between methylation patterns and target variables

  • Linear Regression: Performed regression analysis on individual features to validate biological relevance

  • P-value Interpretation: Applied statistical significance testing for feature validation

Data Visualization

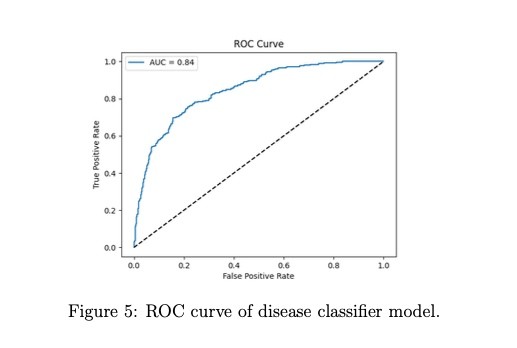
  • Model Performance Metrics: Created confusion matrices, ROC curves (AUC), and evaluation metric tables

  • Feature Analysis Plots: Developed SHAP summary plots, scatter plots with regression lines, and distribution visualizations

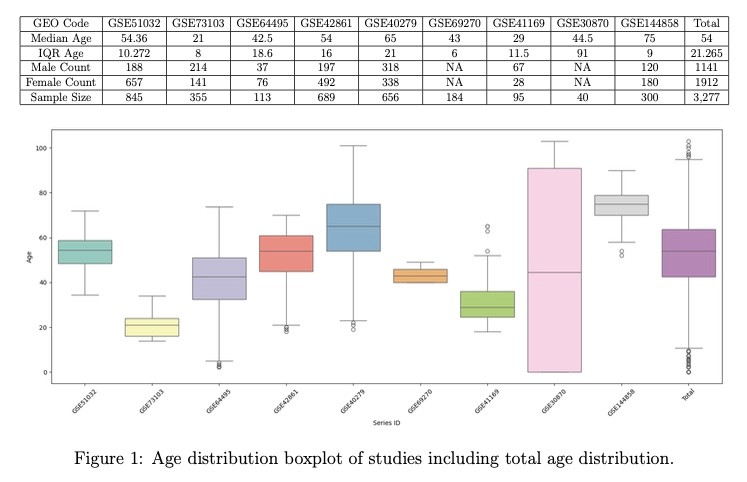
  • Data Distribution: Generated boxplots and age distribution analyses across multi-study datasets

Bioinformatics & Domain Knowledge

  • Genomic Data Analysis: Processed DNA methylation β-values from Illumina BeadChip arrays (450K, 850K platforms)

  • Gene Annotation: Utilized R packages (IlluminaHumanMethylation450kanno, IlluminaHumanMethylationEPICanno) for CpG-to-gene mapping

  • Public Database Navigation: Retrieved and processed datasets from NCBI Gene Expression Omnibus (GEO) database

  • Biological Validation: Connected machine learning findings to established biological markers and literature

Programming & Tools

  • Python: Primary language for data processing, modeling, and analysis

  • R: Used for genomic annotation and methylation data processing

  • Version Control: Maintained project repository on GitHub for reproducibility

Model Evaluation

  • Regression Metrics: Mean Absolute Error (MAE), Median Absolute Error (MedAE)

  • Classification Metrics: AUC-ROC, F1 Score, Accuracy, Precision, Recall, False Positive/Negative Rates

  • Performance Benchmarking: Compared model results against published epigenetic clock studies

Research Methodology

  • Dataset Curation: Systematically identified and selected 11 studies meeting specific inclusion criteria from public repositories

  • Multi-Study Integration: Combined 4,303 samples across 9 studies for age prediction and 823 samples across 2 studies for disease classification

  • Experimental Design: Developed separate pipelines for age prediction (regression) and Alzheimer's classification (binary classification) tasks

Key Questions and Key Findings

Key Questions

1. Can DNA methylation patterns accurately predict chronological age from blood samples?

Finding: Yes. The age prediction model achieved a Mean Absolute Error (MAE) of 3.01 years and Median Absolute Error (MedAE) of 2.40 years using 500 optimized CpG sites from 3,277 blood samples spanning ages 0-103 years. This performance is competitive with established epigenetic clocks, outperforming Horvath's multi-tissue clock (MedAE: 3.6 years) and Hannum's blood-based clock (MedAE: 3.9 years), despite being trained on fewer samples.

2. Which genetic markers are most strongly associated with aging?

Finding: The model identified ELOVL2, FHL2, KLF14, and TRIM59 as key aging-associated genes, with multiple CpG sites mapping to these genes appearing in the top 20 most important features. Thirteen of the top 20 CpG sites showed strong correlation with chronological age (r 0.7), with the strongest performer (cg23500537) achieving r = 0.912 (p < 0.001). These genes have been consistently validated in previous epigenetic clock studies, confirming the model's ability to identify biologically relevant biomarkers.

3. Can DNA methylation profiles distinguish Alzheimer's disease patients from healthy controls?

Finding: Yes, with good discriminatory power. The classification model achieved an AUC-ROC of 0.844, indicating strong predictive ability, with 79% overall accuracy. The model correctly identified 161 of 247 Alzheimer's cases (63.3% recall) and 488 of 576 healthy controls, resulting in a false positive rate of 13.9% and false negative rate of 36.6%. While performance was lower than multi-modal approaches combining brain imaging and cognitive tests, it demonstrates the viability of blood-based methylation as a non-invasive screening tool.

4. What genetic biomarkers differentiate Alzheimer's disease from healthy aging?

Finding: The model identified SCGN, FKBP5, GATA4, ORMDL3, IRF3, and SPIDR as genes associated with Alzheimer's-specific methylation changesall previously linked to Alzheimer's disease in prior literature. Importantly, when analyzing the correlation of these Alzheimer's-associated CpG sites with chronological age, most showed weak or no correlation (8 of 15 sites had r < 0.5), suggesting they capture disease-specific signals independent of normal aging patterns. This distinction is critical for developing biomarkers that differentiate pathological aging from healthy aging.

5. How does feature engineering impact model performance on high-dimensional genomic data?

Finding: Strategic feature engineering was essential for handling 485K-893K features with significant missing data. Initial chunked models achieved MAE of 3.67-3.97 years for age prediction and AUC of 0.65-0.72 for Alzheimer's classification. After SHAP-based feature selection reducing to 500 top features and Optuna hyperparameter optimization, performance improved to MAE of 3.01 years and AUC of 0.844representing approximately 20% improvement in both tasks. This demonstrates that intelligent dimensionality reduction not only reduces computational costs but also enhances model generalization and prevents overfitting on high-dimensional biological data.

more projects

more projects

more projects

Copy Email

CONTACT@VOID.COM

PST

1:25 PM

let’s collaborate

Copy Email

CONTACT@VOID.COM

PST

1:25 PM

let’s collaborate